|
Pittsburgh Daily Climate Reports

The City of Pittsburgh lies underneath a menacing
blanket of storm clouds on March 15, 2012.
The storm itself was insignificant, as weather events go, but the picture
is fantastic.
Photo Credit: Jason Furda - Devine Mayhem Studios.
Blame it on the Ice Age?
Seasonal ice and flooding in the
Pittsburgh Region is not just a present-day phenomenon. Floods have been
plaguing the region for nearly 20,000 years, since the last Ice Age.
It was the time of the Wisconsin Glacial Episode, the last major advance of the
continental glaciers. Wisconsin glaciation covered Canada, the Upper Midwest
and New England. It radically altered the North American landscape north of
the Ohio River.
Prior to the glaciers, the pre-historic
Monongahela and Ohio rivers flowed northward into Lake Erie. They were joined
northward by three streams that over time merged to become the Allegheny River.
After the glaciers advanced into the region, the southern shores of Lake Erie
became icebound. The streams and rivers flowing into the lake were forced to
find other outlets.

Gradually, huge pools formed at the
stream mouths causing back flooding. In the vicinity of what is now Moundsville,
West Virginia, the Ohio River began flowing towards the southwest. The
Monongahela River had always flowed north, but because of the flooding in
the Lake Erie area it began to drop its suspended silt into its lower reaches.
When the ice cap began to melt and retreat northward, the Allegheny Basin filled
with deposits of glacial sediment left by the ice sheet.
These glacial deposits contributed to
the present problems of flooding. In some areas, these deposits are over 150
feet deep. The land reacted when the glacial pressure eased, elevating up to
350 feet in some areas. This upheaval formed the divide just south of Lake Erie
and ever since has caused the drainage of the basin to be southward towards
Pittsburgh and the fork of the three rivers.
Flood Stage - 24 feet
The river level at the fork of the
Ohio generally hovers slightly above the 15 to 16 foot mark. It's normal for
Pittsburgh to reach flood stage at least once a year, either as the result of
heavy winter snowfall or a warm weather low-pressure system that dumps an
abnormally high amount of rainfall along the river basins.
Flood level at Pittsburgh's Point is
set at 24 feet. Other area flood much sooner. Water begins to flow onto the
North Shore Riverwalk at 19 feet and the 10th Street Bypass floods at 22.5
feet. The wharf floods when the river rises to 18 feet and is completely
underwater at 19.5 feet. Another two feet and water begins to flow onto the
adjacent Parkway East.
 
Left - The Point in downtown Pittsburgh
on November 21, 2003, when the river crested at 25.86 feet.
Right - The flooded Mon Wharf on March 14, 2010, with a river crest
of 22.6 feet.
On November 21, 2003, the rivers
crested at 25.86 feet. The Mon Wharf and the Allegheny Riverfront were submerged.
The stretch of the Parkway East along the riverfront heading towards the Fort
Pitt Tunnels, known as the bathtub, was submerged and the Point flooded up to
the top of the steps leading to the fountain. The outer ring of the fountain
was totally submerged and obscured from view, with only the elevated spout above
the water level. This is the result of a rather average yearly flood, with water
around two feet above flood level.

The Point in downtown Pittsburgh
on January 13, 2018, when the river crested at 25.5 feet.
Now try to imagine what the result
would be if the river waters rose to the level of thirty feet or more. It has
happened over twenty-five times since the inhabitants of the city began charting
river levels in the 1760s. Several of these floods have been devastating, with
waters cresting above forty feet twice, in March of 1763 (41'0") and in
March of 1936 (46'4").
The 100-Year Flood and the 500-Year Flood
Flood experts generally describe floods
statistically. For example, some flooding is expected to occur on an average
of one and a half years. Large, damaging floods occur statistically once every
100 years, and truly devastating floods occur once every 500 years.
In reality, floods occur at very
irregular intervals, and the severity of flooding varies greatly as well. In
downtown Pittsburgh, where the normal pool elevation of the three rivers is
710 feet above sea level (15 to 16 feet actual water depth), a 100-Year flood
would raise the water level twenty feet (35 to 36 feet actual water
depth). A 500-Year flood would increase the water level by an additional
ten feet or more.

During the Great Saint Patrick's Day Flood
of 1936 floodwaters
peaked at 46.4 feet. It was classified as a 500-Year Flood.
Despite the statistical infrequency,
downtown Pittsburgh has suffered seven 100-Year floods (35+ feet) in the 20th
Century alone. Many others rose to within a foot or two of the classification.
The disastrous St. Patrick s Day Flood of 1936, which peaked at over thirty feet above normal pool level
(46'4" actual water depth), was a record-setting 500-Year flood and the
worst to hit the Pittsburgh region.
Over the course of Pittsburgh's
history, the city has been the scene of fifteen floods over the 35 foot level.
That's fifteen 100-Year floods in 250 years. Luckily, due to the flood
controls in place, the city has had only two 100-Year floods since
1942.
Attempts at Flood Control
After the Big Flood of
1907, Pittsburgh petitioned
the government to begin the system of flood control measures. The Chamber of
Commerce estimated that the persistent flooding had caused between
$150,000,000 and $200,000,000 in damages to the city. The plans stalled.

The Big Flood of 1907 spurred local
politicians to begin work on flood control measures.
Unfortunately, it took the St. Patrick's Day
Flood twenty-six years later
to spur the federal government to action. Within weeks of the disastrous 1936
flood, which totally obliterated the town of Johnstown, President Franklin
Roosevelt signed into law a bill that would provide funds for the systems of
dams, locks and reservoirs that now provide a measure of safety.
The development of flood controls has
helped alleviate the worst flooding problems along the rivers. For example,
record flooding during Hurricane Agnes in 1972 occurred in the upper Allegheny River drainage
basin in New York and northern Pennsylvania. However, the severity of flooding
was greatly reduced in Western Pennsylvania by the Kinzua Dam in
McKean County and the locks and dams system along the river.
A lot of water went downriver, but not
nearly as much as would have if the controls were not in place. At the Point
in Pittsburgh, river levels were estimated to be twelve feet lower because of
the control system. Flood stage was estimated to be nearly thirteen feet lower
during the flood of January, 1996.
 
The Kinzua Dam (left) in McKee County
and the Emsworth Locks and Dam. Flood control measures
like these have greatly reduced the severity of major flooding
in the Pittsburgh region.
As effective as the controls are,
however, even they cannot completely alleviate flooding problems. Man-made
flood control systems are designed primarily to maintain floodwaters within
a narrower area than they would cover naturally. To compensate for that part
of the floodplain protected by the flood control system, backup of the
floodwaters will occur, thus increasing the elevation of floodwaters
upstream. Despite the threat to upstream dwellers, the system works.
Perhaps the most convincing example
of the effectiveness of these flood control measures occurred during the
one-two punch of Hurricane Francis and Hurricane Ivan during the summer of
2004. Francis dumped a record rainfall amount of 3.60 inches, followed nine
days later by Ivan, which surpassed that record by unleashing an incredible
5.95 inches on the already saturated region.

The system of flood control locks and dams
built by the Army Corps of Engineers.
On September 19,
2004, the rivers
crested at 31 feet. Although surrounding municipalities such as Carnegie
suffered catastrophic consequences from overflowing creeks and tributaries,
the downtown area was spared the full wrath of the rivers, relatively speaking.
Although flooding was bad in the city, the consequences of such a tropical
deluge could have been equal to or worse than the Great Flood of
1936.
The total rainfall for the year 2004
shattered the previous record for yearly precipitation, set fourteen years
before, in 1990, by over five inches, finishing with a whopping 57.41 inches.
Fourteen years later, in 2018, persistent heavy rains throughout the year
pushed the rainfall total to 57.08 inches through December 30. Library Road,
Saw Mill Run and Banksville Road saw several instances of widespread flooding
and the rivers downtown exceeded flood stage twice.
Wettest Year and Wettest Day
When the clock turned midnight on New
Years Eve, the National Weather Service reported that 0.75 inches had fallen
during the day, bringing the yearly total to 57.83 inches. That makes 2018 the
"wettest year" in recorded Pittsburgh history. And the deluge didn't end there.
An additional 52.46 inches fell the following year, 2019 (third highest total on
record).
Six years later, in 2024, the skies opened
up once more on the Pittsburgh region. The month of April began wet, and got
progressively wetter. Then, on Thursday, April 12, when nearly three inches fell,
a record shattering amount for the day. This doubled the previous daily
mark, set in 1933.
The National Weather Service recorded that
rainy Thursday as Pittsburgh's 25th Wettest Day, a record that hasn t been broken
since 1871. They also noted that April 2024 has so far seen the most rain of any
month on record in Pittsburgh during the first twelve days.
For more statistical rainfall
information:
NOAA Precipitation Statistics.
Record Floods in Pittsburgh
|
31'0"
34'6"
35'8"
31'6"
32'4"
33'4"
36'6"
35'1"
32'4"
32'1"
46'4"
34'0"
30'4"
31'0" |
|
2004, September 19
1996, January 20
1972, June 24
1964, March 11
1954, October 16
1945, March 7
1942, December 31
1937, April 26
1937, January 23
1936, March 19
1936, March 18
1936, March 17
1924, January 4
1913, January 9 |
38'7"
32'0"
35'6"
36'3"
36'5"
30'9"
31'9"
35'1"
38'2"
36'2"
35'2"
37'1"
41'0"
39'2" |
|
1907, March 15
1904, January 23
1902, March 1
1901, April 20
1884, February 6
1861, September 21
1852, August 19
1852, April 19
1832, February 10
1816, February 15
1810, November 9
1806, April 10
1763, March 9
1762, January 9 |
 
Storm clouds over Brookline (left) and
PNC Park on July 10, 2013 from a derecho that passed through Pittsburgh.
The heavy rains caused minor flooding along the three rivers, but disastrous
flooding occured along tributaries
like Saw Mill Run Creek in South Park and Little Saw Mill Run along Banksville
Road. The photos below
show flooding at the South Park Fairgrounds and along Banksville Road near the
Parkway West.
 
Other
Disasters - Snowfalls, Tornados and Earthquakes
"Let It Snow, Let It Snow, Let It Snow"
It snows in Pittsburgh. That's
a fact of life in the Midwest. Sometimes it snows quite a bit. A ten inch
snowfall can temporarily paralyze the city, making life difficult for the
local populace. Snowfalls exceeding one foot can cause serious disruption,
and those approaching two feet can rival the damaging consequences of the
100-Year flood. Pittsburghers have experienced a four twenty-plus inch
snowstorms since the late 1800s.
 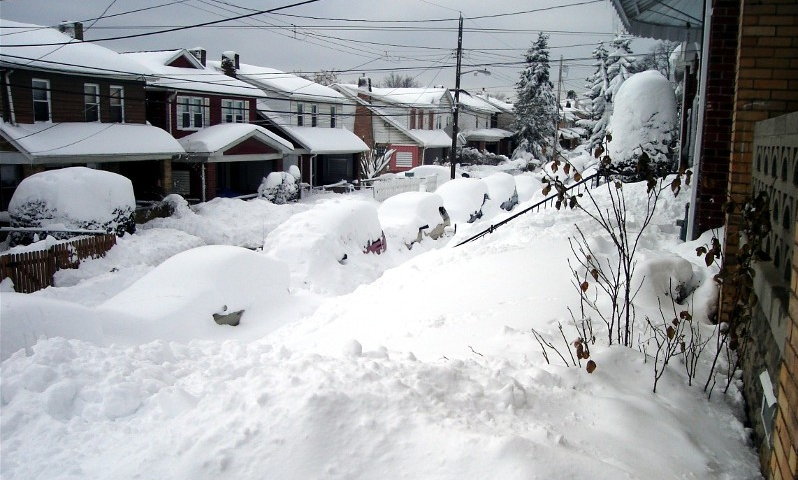
On February 6, 2010, residents on
Bellaire Place in Brookline woke to a whopping 21.1 inches.
<Hazards Remain In Aftermath Of
Massive Storm - February 7, 2010>
Most recently, on February 5th and
6th, 2010, the city was covered with a 21.1 inch blanket of the white stuff.
Downed trees and power lines caused over 100,000 homes to lose power.
Travel around the city was nearly impossible. Stranded vehicles dotted the
roadways. After 24 hours the snowfall ceased and it was time to dig out.
Residents often found their cars completely encased in a mound of snow. The
National Guard was called in to assist municipal efforts. The storm generated
the fourth highest snowfall amount on record in Pittsburgh.
Left - The Boulevard of the Allies in
downtown Pittsburgh during the February 2010 snowstorm.
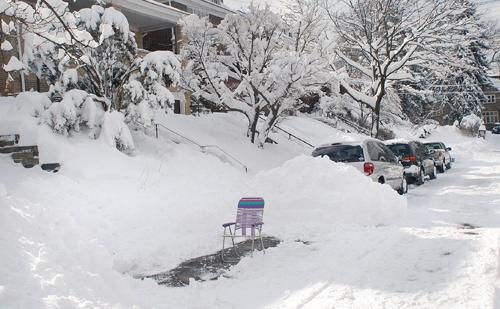
Right - The Parking Chair. Clear the snow and mark your spot. Some love'm and
some hate'm.
According to some historians, the use of the Parking Chair began right here in Pittsburgh.
Three days later, on February 9th and
the 10th, 2010, a second storm dropped 7.9 inches to increase the six-day total
to 29.0 inches. Statistically, it was the second highest back-to-back (within two
weeks of each other) storm total, replacing the 27.0 inches that fell in the dual
storms of January 16th and January 21st, 1978. The snow continued to fall. By
month's end, February 2010 (48.7 inches) had eclipsed January 1978 (40.2 inches)
as the snowiest month ever in the city.
 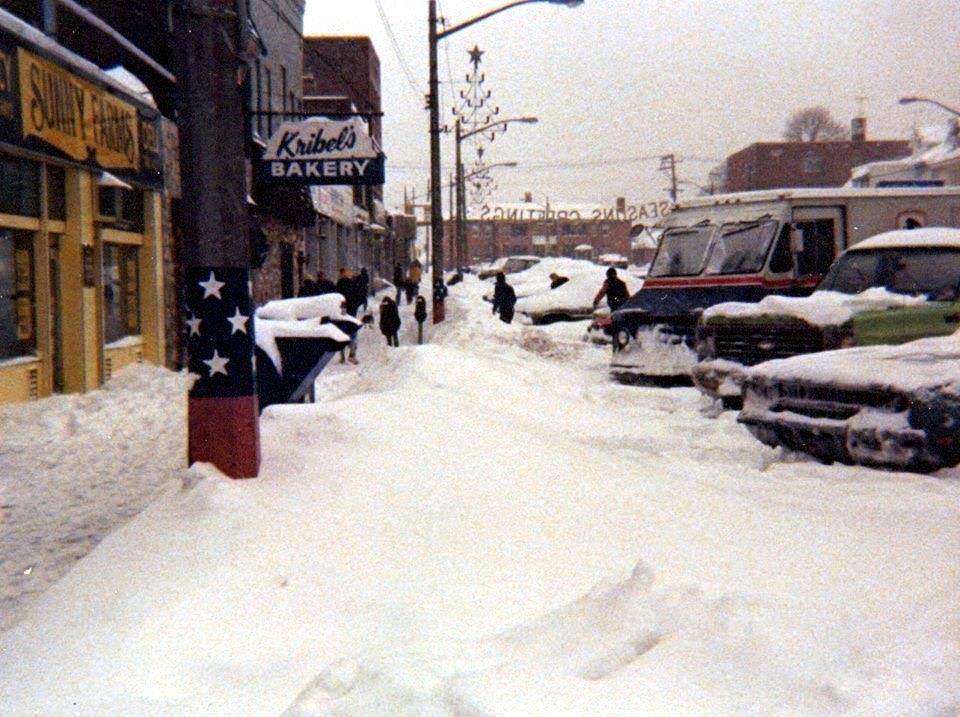
Brookline Boulevard on January 21, 1978,
after the second major snowstorm in a week.
Another major snowstorm was the Blizzard of 1993, when for three days in March, snow fell without
pause. When it was over, the total accumulation in Pittsburgh amounted to 25.3
inches and third place on the overall list. Nationally, the Nor'easter was called
the Storm of the Century due to it's intensity, massive size and wide-reaching effect.
The Superstorm stretched from Central America to Eastern Canada, affecting twenty-six
states in the United States.
The second largest single blizzard total was
recorded during a storm in mid-December of 1890, when the city was covered in a 25.9
inch blanket of fluff. A followup storm began one week later on Christmas Day which
dumped an additional 13.2 inches, for a grand total of 39.1 inches. These two
snowfalls together amounted to the largest back-to-back storm total in Pittsburgh
weather history.
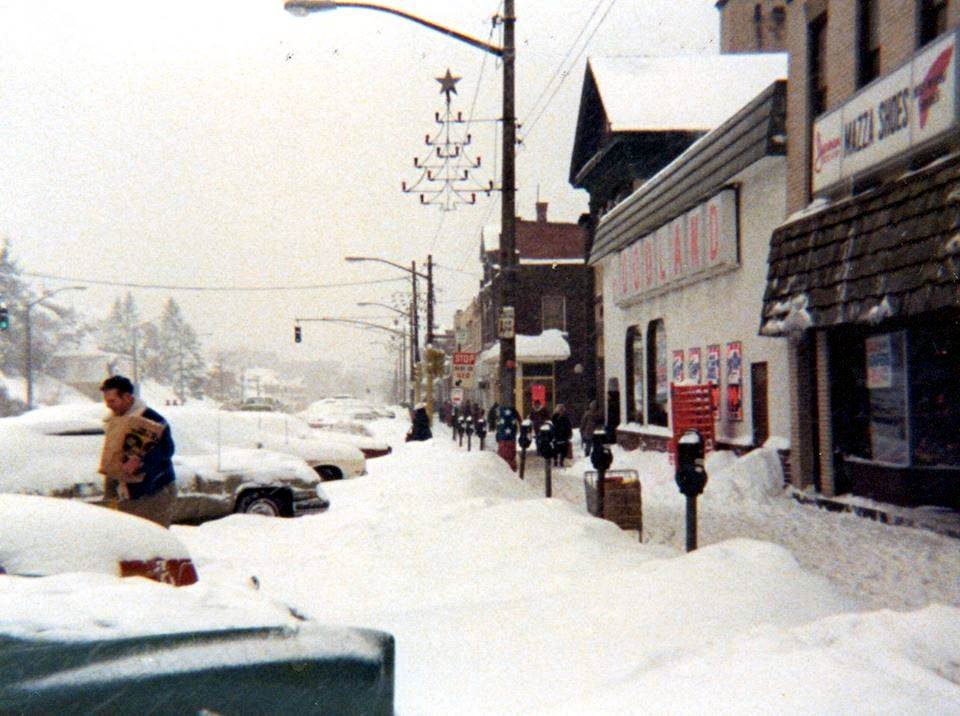
But, as terrible as these snowfalls were,
they could not compare with the Granddaddy of all arctic snowstorms, the
Thanksgiving Blizzard of 1950. Officially, 27.4 inches were recorded at the
airport. Some neighborhoods, like Brookline, were buried in over thirty inches
of snow. For three days, city workers labored to clear the streets and the
National Guard was called upon to keep order in the paralyzed city.
 
Left - Automobile traffic on Brookline
Boulevard the day after the blizzard - November 1950;
Right - Pittsburgh's public transportation ground to a halt during the
Thanksgiving storm.
 
A snow covered vehicle along Saw Mill
Run Boulevard in Overbrook (left) and the Pennsylvania National Guard,
bringing out the big guns in an effort to help clear roads of stranded vehicles
and restore order.
For more statistical snowfall
information:
NOAA Snowfall Statistics for
Pittsburgh.
Brrrrrrrrrr!

Sometimes it's not so much the snow
that poses the greatest risk during the snowy months. It's the bitter cold
of winter that chills the heart and makes it difficult to travel, let alone
go outside the front door. Frostbite can set quite quickly in subzero
temperatures, and proper cold-weather clothing is essential for those
who dare to brave the cold.
The longest recorded period of
persistent sub-zero temperatures was a fifty-two hour stretch from January 18
through January 20, 1994. The lowest temperature on record in Pittsburgh,
-22 degrees, was set during that cold spell, on January 19, 1994.

The longest period of sustained
sub-freezing temperatures was a thirty-three day cold spell lasting from
December 26, 1976 through January 27, 1977. Many Pittsburghers who were in
elementary or high school during that blast of frigid weather were treated
to an extended holiday vacation. Fuel oil was in short supply, it was the
third snowiest January on record and the wind-chill was dangerously low.
Many local area schools remained closed until February.
For historical information
on cold weather:
NOAA Pittsburgh Cold Weather
Statistics.
 
Ice forms along the Allegheny River during
periods of bitter cold.
Sometimes It Can Get Really Hot, Too
On the other side of the weather spectrum
is the threat of high temperatures and prolonged heat waves. Like too much rain,
too much heat can have devastating consequences and pose serious health risks
to both young and old alike. When humidity is factored into temperatures
above 90 degrees, Pittsburgh truly becomes a mid-western melting pot.
The highest temperature on record in
Pittsburgh was set on July 16, 1988, when the thermometer peaked at 103 degrees.
This was the third time in the City's history that the mercury reached that
level, tying the record set on July 10, 1881 and again on August 6, 1918.
Pittsburgh temperatures have hit 100 degrees or higher twenty times since
1871.

The hottest year on record was 1921,
when the annual average reached 55.4 degrees. The warmest day was August 6,
1918, when the mean temperature averaged out at 92 degrees. As for cumulative
90 degree days and longest heat waves, 1988 was a record year,
with thirty-eight days of temperatures at or above that level of mercury.
Two of the three longest heat waves (temperature above 90 degrees) in the
City's history were recorded that summer. For thirteen days, from July 4 to
July 16, and again for ten days, from August 8 to August 17, Pittsburgher's
roasted in the sweltering heat.
In a touch of bitter irony, after
suffering through the Great Saint Patrick's Day Flood in March 1936,
Pittsburghers endured the most intense heat wave in the City's history
the following July 1936, when for eight consecutive days the temperatures
hit 95, 101, 101, 94, 98, 93, 102 and 91 degrees.

The sun rises over the misty
shroud covering Brookline Park on March 17, 2012.
If Global Warming has a signature, some might say the month of March, 2012, looked
like the real thing. As monthly heat waves go, the eleven-day period from
March 13 through March 23 shattered the previous March monthly mark of five
consecutive days set in 1990. The 70-plus degree daily high temperatures were
over thirty degrees above normal for that time of year. For the record, the
month of March 2012 posted the highest March monthly average mean temperature
ever (51.5 degrees) for the City of Pittsburgh.
For historical information
on warm weather:
NOAA Pittsburgh Warm Weather
Statistics.
Twisters and Macro-Bursts
As the clock ticked towards the
end of the 20th Century, a new atmospheric phenomenon burst onto the
scene, causing further concern for weather weary Pittsburghers. Large
and dangerous storms have begun to produce tornados and macro-bursts.
Twisters are a fairly common occurrance north of the city in places like
Butler County, but a Golden Triangle Twister is a true rarity.
Prior to 1998, the last recorded tornado in Pittsburgh occurred near
Lincoln Place in 1944. The last time downtown Pittsburgh suffered
a direct hit was over a century ago, in January of 1889.
Pittsburgh dodged a bullet back
on May 31, 1985, when a line of violent storms with multiple funnel
clouds left 65 dead, destroyed 1,009 homes and caused an estimated
$375 million in damage in Western Pennsylvania. The town of Wheatland,
Pa was totally obliterated by the only F5 tornado ever recorded in the
state of Pennsylvania. One funnel cloud associated with that storm system
did touch down just north of Pittsburgh.

Pittsburghers developed a certain
sense of protection from the hills surrounding the city. Those hills would
act as a barrier and keep Mother Nature's fury away. It was a false sense
of security. Beginning in 1998, Pittsburgh has been the target of three
twisters and a series of macro-bursts after a 54-year calm.
The first occurred on June 2, 1998,
sixteen people were injured by a twister that touched down west of the city,
then proceeded along the Parkway West towards Mount Washington. The tornado
soon reached the city, and the overlook hillside was blanketed in a large black
cloud. Moments later, when the cloud dissipated, stunned residents emerged
to find several homes damaged along Grandview Avenue and surrounding streets.
Roofs and walls were torn from several structures. Trees were uprooted and
debris littered the area. Several large trees lining Herschel Field were
sheared away, broken in half like twigs. The tornado was the first to breach
the city limits in 109 years. It registered as an F1 on the Fujita
Scale.
 
Governor Tom Ridge
and Mayor Tom Murphy inspect damage in Mount Washington.
<Fronts created Tornado
Alley> <> <Residents Weather Stormy
Evening>
<Region Torn Asunder By Hard-Hitting
Storms>
<><><><><><><><><>
<><><><><><><><><>
<><><><><><><><><>
On June 1, 2002, Kennywood Park
in West Mifflin was the scene of a macro-burst that ripped the roof off
of the pavilion covering The Whip, a ride in the Lost Kennywood section,
hurling the structure onto a crowd of frightened onlookers. The powerful
storm produced wind gusts registering over 80 mph. One person was killed
and over fifty injured in the tragedy. Several trees in the historic Trolley
Park were damaged or destroyed. The fierce storm also damaged buildings in
Lawrenceville, Homestead, East End and Bloomfield.

Firefighters inspect
damage in Kennywood Park.
<Kennywood Park Witnesses Describe Chaos
at Whip Ride>
<Woman Dies in Kennywood Collapse as Fierce
Storms Tear Through Region>
<><><><><><><><><>
<><><><><><><><><>
<><><><><><><><><>
A year later, on June 12, 2003, a strong
thunderstorm produced a funnel cloud. The vortex travelled from Greentree to Mount
Washington, as seen from Flagstaff hill in Schenley Park. The following day the
National Weather Service confirmed that the funnel cloud was indeed an F0 tornado
with 75 mph winds. It was Pittsburgh's second tornado in five years, but it
would not be the last. The 2003 twister is shown in the photos below.
 
An F0 tornado that hit Greentree and Mount
Washington photographed from Schenley Park in June 2003.
<Tornado-like Winds Fell Trees
Throughout Region>
<Storm Damage Wasn't Too Bad, Considering
It Was A Tornado>
<><><><><><><><><>
<><><><><><><><><>
<><><><><><><><><>
On August 9, 2007, a
storm system blew through Pittsburgh and produced multiple funnel cloud
sightings, accompanied by an 85 mph microburst in the Uptown district.
In Sheraden, near Chartiers Avenue, trees were uprooted and projectile damage
was done. An F-0 tornado was confirmed the following day by the National
Weather Service.
<It's Official: Tornado Hit
Sheraden>

<><><><><><><><><>
<><><><><><><><><>
<><><><><><><><><>
On June 17, 2009, a rapid
series of powerful thunderstorms produced multiple funnel cloud sightings.
The storms dumped over three inches of rain in some locations, causing severe
flash flooding. On the University of Pittsburgh campus in Oakland, Forbes Avenue
became a river, stranding several motorists in water that reached three feet deep
in some areas.
<Big Storm Pummels The Region>
Although there were no confirmed
reports of a tornado touch down, Becky Yeargers of Upper St. Clair snapped
the photo below of a funnel cloud threatening the southern suburbs.
 
Flooding along Forbes Avenue in Oakland and
a funnel cloud in Upper St. Clair - June 2009.
<><><><><><><><><>
<><><><><><><><><>
<><><><><><><><><>
Most recently, on March 23, 2011, a strong
storm system ripped through the Pittsburgh area, dumping quarter-sized hail
throughout the city. Fifteen miles to the west, the ominous clouds unleashed a
tornado, packing 120 mile per hour winds, upon Westmoreland County. There were
multiple reports of downed trees and power lines. Roofs were ripped off houses
in Fort Allen, Hempfield and Irwin. Other areas that sustained heavy damage
included Sewickley Township, North Huntingdon, Rillton and Herminie. The damage
followed a line south from Route 30 to I-70, roughly along Route 136. The twister
ranked an F-2 on the Fujita Scale, the strongest to hit the region in
decades.
<Violent storm tears through Westmoreland,
damages Hempfield Area High School>
<Tornado damage reaches $4M,
30 Hempfield homes destroyed along 7-mile path>
<Trib-Live Photo Slideshow of Tornado
and Damage>
 
The F2 tornado as seen by drivers
along Route 30 in Hempfield Township on March 23, 2011.
"Did Somebody Say ... Earthquakes ???"
And last, but not least, who ever thought
that the City of Pittsburgh was located in an earthquake prone area? Well, it is
not. However, on March 1, 1935, the city did experience a slight tremor. That was
one for the record books, until, on June 23, 2010, the city received another gentle
nudge from a seismic event centered around Toronto, Canada. The Post-Gazette
article below documents the 2010 magnitude 5.5 event.
<Canada-centered earthquake felt in Western
Pennsylvania>

Seismographic reading registered in
Pittsburgh, Pennsylvania - 6/23/10.
<><><><><><><><><>
<><><><><><><><><>
<><><><><><><><><>
Most recently, on August 24, 2011, the
City of Pittsburgh was shaken by another tremor, this one a 5.9 magnitude quake
centered in Richmond, Virginia. This latest earthquake lasted nearly thirty seconds
and caused buildings around the Pittsburgh area to shake, prompting numerous
evacuations and some structural damage.
<Earthquake shakes region; buildings
evacuated>
 
Bricks fell from this home on California
Avenue (left) and seismographic readings from August 24, 2011.
Ironically, we can blame these tremors
on the Ice Age also, as the earthquakes were likely caused by post-glacial rebound. The massive glaciers that descended upon North
America exerted extreme downward pressure on the Earth's surface plates. These
plates continue to slowly rebound upwards, a process that may take another
10,000 years.
The Calm After The Storm ... Rainbows Over
Pittsburgh

Not all inclement
Pittsburgh weather has a negative outcome.
Sometimes a spring rain can have fascinating results.
 
A rainbow is caused
by reflection, refraction and disperson of light in
water droplets resulting in a spectrum of light appearing in the sky.
 
On a hot summer day,
the fountain at Point State Park can
be a refreshing treat, creating its own mini-rainbow.

* Compiled from multiple
sources; Last Updated - April 12, 2024 * |
